8-TECH-3 Measuring Rates by NMR
There are three main techniques for measuring rates by NMR spectroscopy:
1. Integration of NMR signals as a function of time. This technique is equivalent to other "laboratory time scale" methods for measuring concentration. It is non-invasive, and so is well suited to studying reactive species where intrusive sampling creates contamination problems, and is very convenient. Some chemical processes, such as certain isotopic exchanges, can be measured by almost no other method. Disadvantages are less precise temperature control, a relatively low accuracy in the measurement of concentrations and the derived rate constants (compared, for example with UV spectroscopy or chemical titration), marginal for measurement of ΔH‡ and particularly ΔS‡, and the requirement that a spectrometer costing hundreds of thousands of dollars be used as a glorified constant temperature bath.
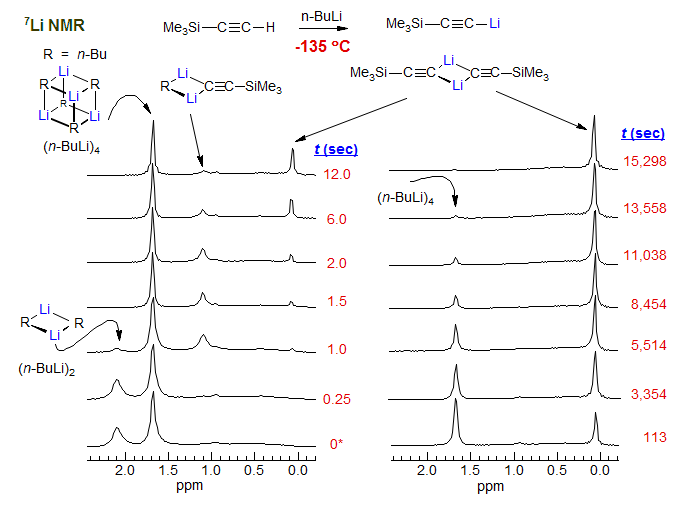
Rapid Injection NMR (RINMR): NMR spectrometers can be fairly easily fitted with a rapid injection device which can be used to mix and take NMR spectra of samples on a second and even sub-second time scale. This allows study of reactions and species having lifetimes in the 0.1 sec to 60 sec range at temperatures down to -130 °C. The technique involves computer-controlled injection of samples directly into an NMR tube in the spectrometer, with computer controlled pulsing at short intervals to detect reactive intermediates. For examples see: McGarrity, J. F., Ogle, C. A. J. Am. Chem. Soc. 1985 107, 1805; McGarrity, J. F.; Ogle, C. A.; Brich, Z.; Loosli, H.-R. J. Am. Chem. Soc. 1985, 107, 1810; Frye, S. V.; Eliel, E. L.; Cloux, R. J. Am. Chem. Soc. 1987, 109, 1862.
A 7Li RINMR experiment at -135 °C (3:1 Me2O / THF): Reaction of n-BuLi dimer and tetramer with trimethylsilylacetylene (Jones, A. C., Sanders, A. W., Bevan, M. J., Reich, H. J. J. Am. Chem. Soc. 2007, 129, 3492).
2. Dynamic NMR: Heisenberg uncertainty broadening of NMR signals occurs when two NMR transitions are interchanged by some physical process (spin-spin relaxation, T2) on a timescale equivalent to the separation of the two signals in Hz. That is, when there is uncertainty about the lifetime of a spin state (Δt), there is uncertainty about the energy (Δν), which causes line broadening. This is a unique capability of NMR spectrscopy, and many processes whose rates are easily measured by DNMR techniques are virtually impossible to study by any other method.

3. Saturation Transfer (Forsen, EXSY). When two NMR signals are undergoing dynamic exchange on the timescale of T1, then saturation of one of the signals causes intensity changes in the other, since saturated nuclei will be transferred between the two sites by the exchange process. These intensity changes can be used to obtain quantitative rate data. (Note: although the experiment itself is very similar to an NOE experiment, the underlying physical processes and information obtained is quite different.)
8-TECH-3.1 Dynamic NMR (DNMR)
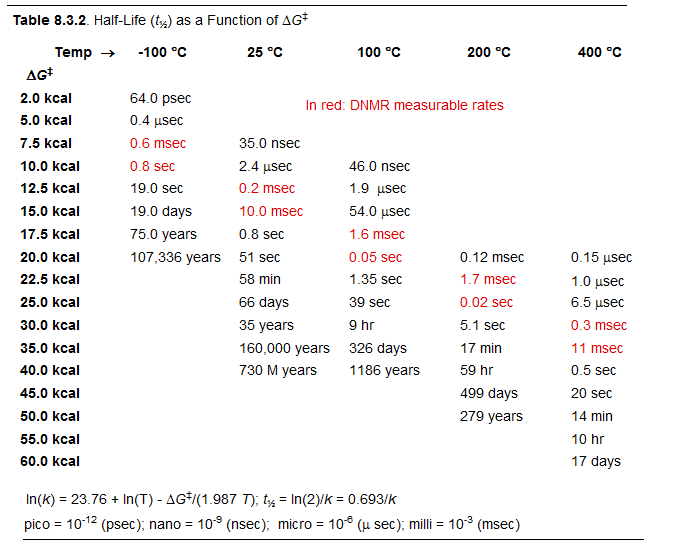
Reversible molecular processes which result in detectable changes in an NMR property (chemical shift or coupling constant) and which occur with rate constants between approximately 10 and 10,000 sec-1 between -150 and +150 °C (corresponding to ΔG‡ from 5 kcal to 26 kcal/mole) can be studied by variable temperature dynamic NMR (DNMR) techniques. The range of free energies that can be covered depends in a major way on the difference in frequency (chemical shift or coupling constant) of the exchanging signals.

There is an important difference between the DNMR method and classical kinetic measurements: only processes which are at equilibrium can be studied. In the large majority of cases degenerate processes have been studied, i.e., processes for which starting material and product are identical, and Keq is by definition 1 (as in the cyclohexane inversion below). Non-degenerate processes (such as the chlorocyclohexane inversion) can also be studied, but it is important to recognize that there must be significant amounts of both species/signals present at equilibrium to see DNMR line broadening effects. Thus an NMR time scale interconversion between an observed species and a minor (<<1%) component will usually have no detectable effects on the NMR spectrum, no matter how fast or slow the rate is. For an analysis of the two-site very unequal population problem, see Anet, F. A. L.; et al. J. Chem. Soc., Chem. Commun. 1976, 399.

The vast majority of processes studied by DNMR are intramolecular in nature. However, a small number of intermolecular reactions have also been studied, most notably proton transfers, but acyl transfers, silyl transfers, ate-complex formation/dissociation, Lewis acid Lewis base dissociations, and ligand transfers between metals have also been amenable to study by this technique.
The DNMR method requires measurement of high quality NMR spectra at a series of accurately known temperatures in the region in which significant line broadening of relevant signals occurs. For intermolecular processes, the effect of a series of concentrations on the rate can also be studied. The determination of accurate rate constants by the DNMR method requires line shape simulations using computer programs such as Binsch's DNMR5 program (Review: Binsch, G. Dynamic NMR Spectrosopy, Jackman, L. M.; Cotton, F. A., Eds., Academic Press, N. Y., 45) or WINDNMR.
Crude estimates of rate constants can be obtained from spectral data using several approximate formulas (see Kost, D.; Carlson, E. H.; Raban, M. J. Chem. Soc., Chem. Commun. 1971, 656; two-site uncoupled system: Gutowsky, H. S.; Holm, C. H. J. Chem. Phys. 1956, 25, 1228; coupled AB system: J. Chem. Phys, 1964, 41, 1033)

8-TECH-3.2 Temperature Measurement in DNMR Experiments
The "dial" temperatures on NMR spectrometers are not accurate enough for measurement of kinetic or thermodynamic parameters. There is both an offset error and a slope error (the offset error changes with temperature). This is because the temperature sensing devices in the spectrometer probe are of necessity some distance outside the sample tube and probe coils. The temperature errors are a sensitive function of cooling/heating gas flow rates, so it is necessary to determine the sample temperature for each temperature setting in a variable temperature experiment. There are three main methods for determining sample temperature.
1. Direct measurement of temperature with a calibrated thermocouple or RTD thermometer. Before and after each experiment the measuring probe is lowered into the sample (not usually practical) or the sample is removed and an open tube containing solvent and temperature probe is lowered into the NMR probe and the temperature measured.
2. Substitution of sample by a chemical shift sample. Here a sample tube containing a material which has a temperature sensitive chemical shift which has been previously calibrated is substituted for the actual sample, and the NMR spectrum is measured. The most commonly used thermometer sample uses the 1H signals of methanol (the OH signal is temperature dependent), which can be used from -100 to +60 °C. At higher temperatures ethylene glycol is often used (Van Geet, A. L. Anal. Chem. 40, 1968, 2227; Van Geet, A. L. Anal. Chem. 42, 1970, 679; Raiford, D. S.; Fisk, C. L.; Becker, E. D. Anal. Chem. 1979, 51, 2050).
3. Both of the above methods require sample substitution and thus do not measure the temperature at the time of the experiment, and they cannot always be used under the actual conditions of the sample experiment. For example the decoupler may have to be turned off during the sample substitution process. Of course, the temperature measuring sample can be placed inside the sample tube (either as a concentric sample tube or as a capillary insert, but this can interfere with sample preparation, and often leads to unacceptable degradation of sample resolution and sensitivity. A better solution is an internal chemical shift thermometer which can be placed directly in the sample of interest, and the temperature is then measured as part of the normal spectrum acquisition process. A compound which is exceptionally good for 13C variable temperature work is tris(trimethylsilyl)methane (Me3Si)3CH, where the 13C chemical shift difference between the CH and CH3 carbons varies linearly with temperature (>1 Hz/°C in a 360 MHz proton frequency spectrometer). Only 1-4 μL of 10% 13C enriched (Me3Si)313CH needs to be added to the sample to provide a true measure of the internal temperature during the actual experiment (Sikorski, W. H.; Sanders, A. W.; Reich, H. J. Magn. Resonan. Chem. 1998, 36, S118-S124). One disadvantage of this technique is that a calibration curve has to be established for each solvent. A number of these have been reported.
In addition to temperature errors resulting from instrumentation issues, the internal temperature of an NMR sample is also perturbed by sample heating from strong decoupling fields (usually 1H). This effect is especially pronounced in aqueous solutions with significant ionic strength (Led, J. J.; Petersen, S. B. J. Magn. Reson. 1978, 32, 1-17). Thus sample temperatures will be higher if the decoupler is on than when it is off.
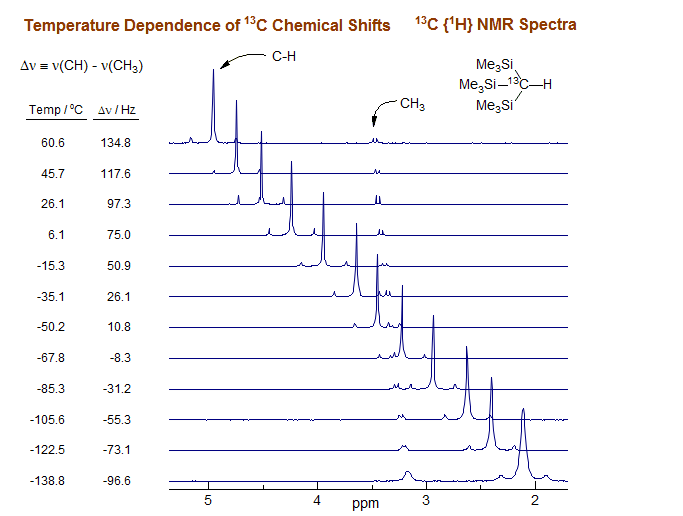
13C NMR spectra (90.56 MHz, 360 MHz proton frequency) from a variable temperature study of 0.20 M tris(trimethylsilyl)methane (13C-H) in 3:2 THF-ether.
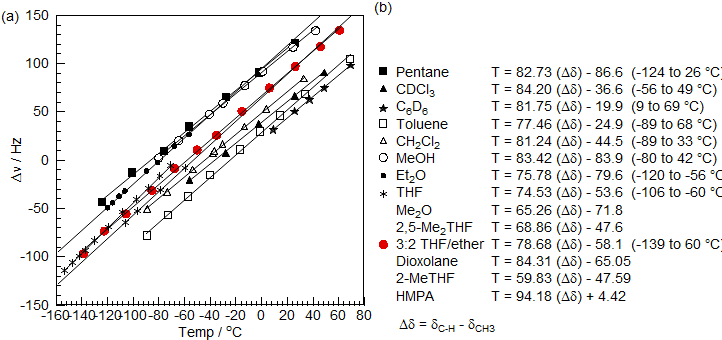
(a) Temperature dependence of the chemical shift difference (Δδ) between the CH3 and CH of (Me3Si)3CH in various solvents. (b) Equations for calculationg temperature from Δδ values. The temperatures given are the range in which the calibration was performed.
8-TECH-3.3 Determination of Thermodynamic Parameters
Enthalpies, entropies and free energies of activation as derived from transition state theory.

There are two common ways to plot rate constant data to determine activation energies using the Eyring Equation:
1. A plot of ΔG‡ vs T will give a straight line with a slope of -ΔS‡ and an intercept of ΔH‡ (eq. 1, Eyring Plot). ΔG‡ is calculated from the rate constant and the temperature using eq. 3. This kind of plot is easier to interpret than the one below since the temperature range of the experiment can be directly read off the graph, and the y-coordinates and slope of the data points is visually interpretable in terms of the size of ΔH‡ the sign of ΔS‡. This is especially useful for comparison of several such plots on a single graph.
2. A plot of ln(k/T) vs 1/T will give a slope of - ΔH‡ / R and an intercept of ln(ki/h) + ΔS‡/R (plot eq. 3). This type of plot is more forgiving (looks better) if the rate data is not too accurate. However, the obscure units of the x and y coordinates as well as of the slope and intercept prevents any meaningful interpretation of the graph itself.

ΔH‡ = -1.9872 (slope)
ΔS‡ = 1.9872 (intercept - ln(κk/h) (κ = transmission coefficient, either 1 or 1/2)
ln(κk/h) = 23.75999 (κ = 1), 23.06684 (κ = 1/2)
8-TECH-3.4 Some Processes that Have Been Studied by DNMR
Rotation Around Bonds - Conformational Changes. Barriers to rotations around hindered single bonds can be conveniently measured by DNMR techniques. cyclohexane ring inversions, as well as those of larger rings are often in the DNMR rate range. Rotations around unhindered single bonds and the interconversion of various cyclopentane half-chair and envelope conformation are generally too fast (ΔG‡ < 5 kcal/mole) . Single bonds with partial double bond character (such as amide bonds), N-nitroso amines and double bonds with partial single bond character (such as aminofulvenes and push-pull alkenes) can be studied.

Pyramidal Inversions. The inversion barriers for amines, imines, carbanions, phosphines, oxonium salts, sulfonium salts, and sulfinyl chiral centers can sometimes be measured by DNMR techniques.

Pseudorotations. Related to inversions are pseudorotational processes of pentacoordinate trigonal bipyramidal P, As and transition metal compounds, and similar geometric reorganizations of tetracoordinated S (e.g., SF4), Se and Te compounds, and tricoordinated Cl, Br, and I compounds (e.g. IPh3). Similarly, internal reorganization of square planar, trigonal bipyramidal and octahedral complexes of many transition metals have been studied by DNMR. Examples: 1, 2, 3.

Ligand Reorganizations. Organometallic complexes with alkene, allyl, diene, pentadienyl, trienyl and other ligands can have multiple bonding sites, and interconversion among these can often be studied by dynamic NMR. This includes end-to-end of σ to σ and σ to π interconversion of allyl complexes, rotations of ethylene ligands, bond slippage along polyene chains, interconversion of octahedral isomers, and migration among other types of coordination sites in a ligand. Examples: 1.

Molecular Rearrangements. Valence bond isomerizations such as the bullvalene and semibullvalene divinylcyclopropane Cope rearrangements, norcaradiene-cycloheptatriene and oxepin-arene oxide isomerizations, ring-chain tautomerization such as homoallyl-cyclopropylcarbinyl isomerizations, 1,2-, 1,3- and 1,5-hydrogen and metal (e.g. silyl) shifts, [2,3]sigmatropic rearrangements, double bond shifts.

Intermolecular Reactions and Ligand Exchanges. Degenerate proton and hydride transfers, exchanges of metal coordinated ligands with the free molecules, transfers of Lewis acids between basic groups, nucleophilic and electrophilic substitution reactions, exchange between aggregates, and host-guest equilibrations. The intermolecular exchange of coordinated groups on many metals can be studied by DNMR techniques. The NMR probe can be of several types: loss of J-coupling between metal and ligand (if both are NMR-active), exchange of chemical shifts between coordinated and free ligands, or averaging of diastereotopic groups due to symmetry changes as a result of substitution processes (e.g. phosphine gold complex).

In the pages that follow are capsule descriptions of a selection of DNMR experiments illustrating the methodology and the types of processes that can be studied.
DNMR - Effect of Chemical Shift
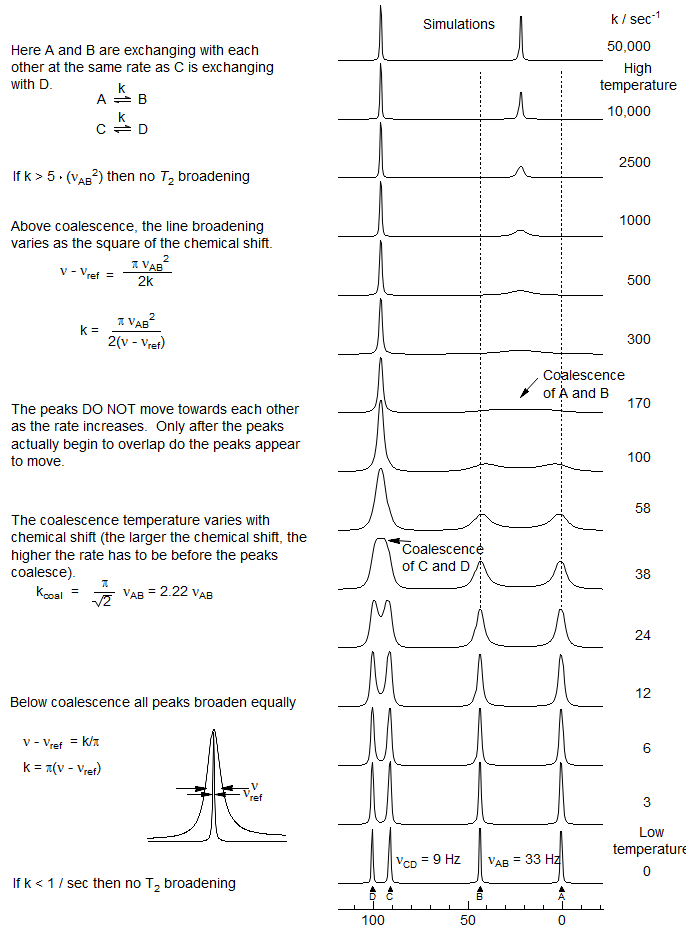
During a DNMR coalescence experiment the peaks that are further apart always become more broadened before merging into one peak than those that are closer together. The graphic below shows simulated lineshapes of two pairs of signals undergoing identical rates of exchange - the A and B signals exchange with each other and are 33 Hz apart, the C and D signals exchange, and are only 9 Hz apart. Note that before coalescence (up to about 12 sec-1) all line widths are the same. However, above this the C/D signals coalesce (at 38 sec-1), but the A/B signals continue to broaden, until they coalesce at a much higher rate of exchange (170 sec -1), and presumably at substantially higher temperature. Note that above coalescence the line broadening is very strongly dependent on the chemical shift (in fact, it varies as the square of the shift).
A consequence of these factors is that the accuracy of activation parameters is strongly affected by the line separation of exchanging signals, since the further apart the signals are, the wider the range of temperatures in which accurate rate measurements can be made, and the more accurate the rate constant will be (broader lines leads to more accurate simulations). This leads to more precise values for ΔS‡ and ΔH‡ derived from an Eyring plot.
8-TECH-3.5 Hindered Rotation around Single Bonds
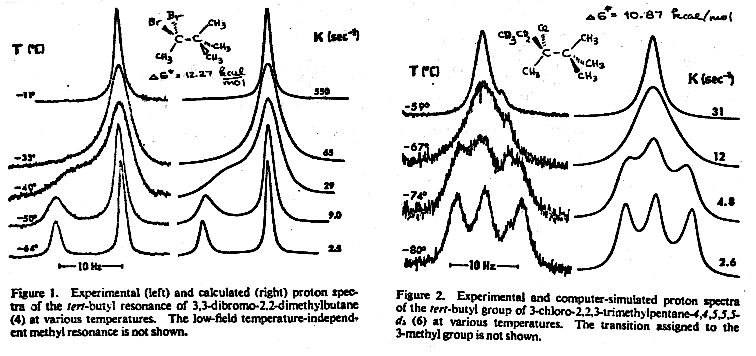
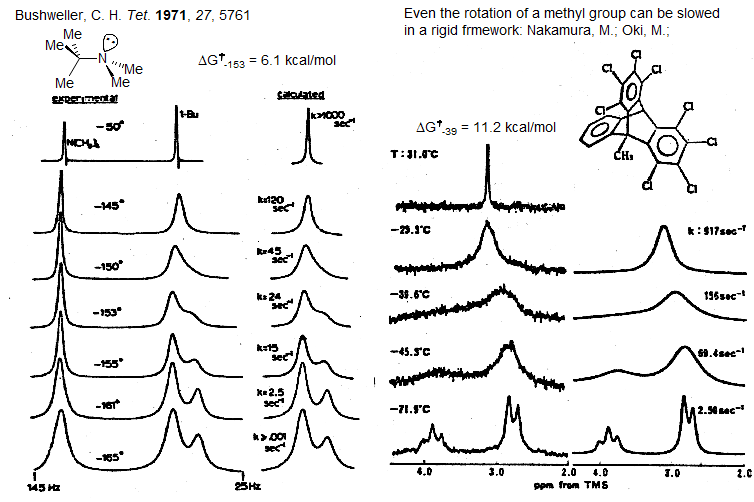
Rotation around most single bands is too fast for DNMR rate measurements (ΔG‡ 2.5-5 kcal/mol). However, tertiary centers adjacent to secondary or tertiary sp3 carbons can have substantial barriers to rotation, easily measured by DNMR techniques. Hawkins, B. L.; Bremser, W.; Borcic, S.; Roberts, J. D. J. Am. Chem. Soc. 1971, 93, 4472. Examples: 1.
8-TECH-3.6 Hindered Rotation Around Partial Double Bonds
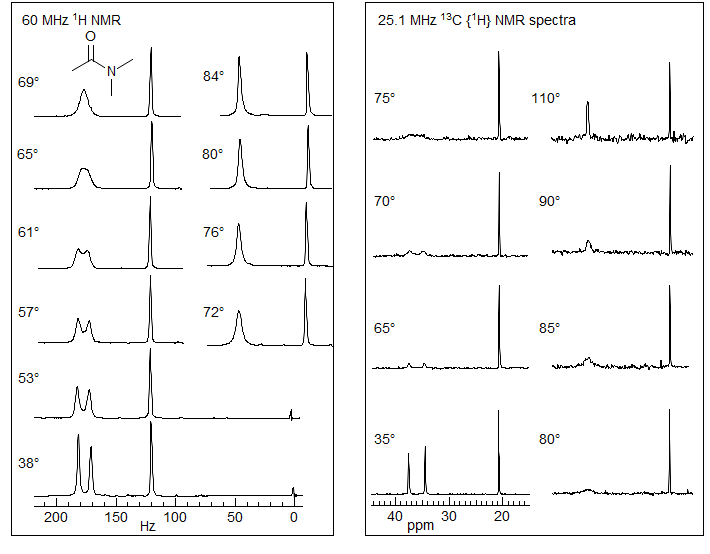
Amide Rotation. Among the most intensely studied molecular processes (using DNMR) is the restricted rotation around amide bonds, because of the importance of the phenomenon in peptide and protein structures and chemical behavior. Some typical spectra (1H and 13C) of a DNMR study of N,N-dimethylacetamide are shown below (from Abraham and Loftus). The two 1H N-methyl peaks have slightly different peak heights because there is apparently a small coupling between one of the N-Me groups and the C-Me group.
The 13C variable temperature NMR study illustrates some of the advantages and disadvantages of C vs H DNMR work:
1. The 13C NMR spectra show considerably more noise, leading to less accurate rate constants
2. The C signal can be hard (or impossible) to detect near coalescence, when there is maximum broadening. This effect is exacerbated by the usually much larger shift in Hz between the C vs the H signals, in this case 10.5 Hz for H and 75.3 Hz for C).
3. Because of the larger shift difference the C spectra show measurable broadening over a wider temperature range (the range is extended to higher temperatures, the low temperature broadening is identical for all nuclei), which could lead to more accurate activation parameters (ΔH‡ and (ΔS‡).
4. There is no interference from coupling in the C NMR spectra, making lineshape simulations much simpler, but also resulting in a less information-rich set of spectra.
5. NOE effects and saturation effects in 13C NMR spectra can cause errors in peak areas, so acquisition parameters have to be chosen carefully. Other amide examples: 1, 2, 3.
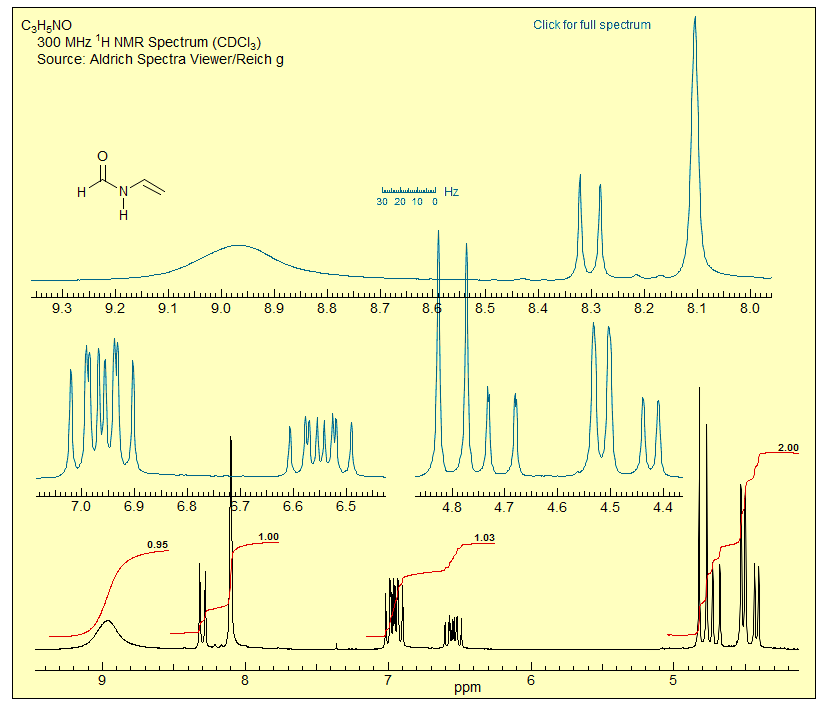
Exercize: Interpret all features of the room temperature NMR spectrum of N-vinyl formamide
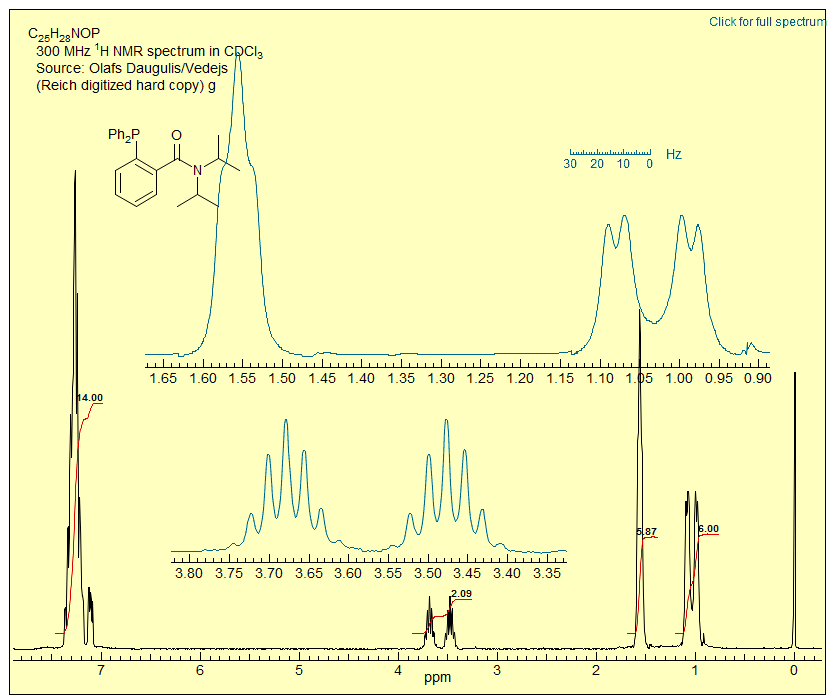
Exercise: (a) Explain the appearance of the CH region around δ 3.6. (b) Explain the appearance of the methyl region (HINT: there is restricted rotation around more than one bond.) Click on the spectrum for an analysis
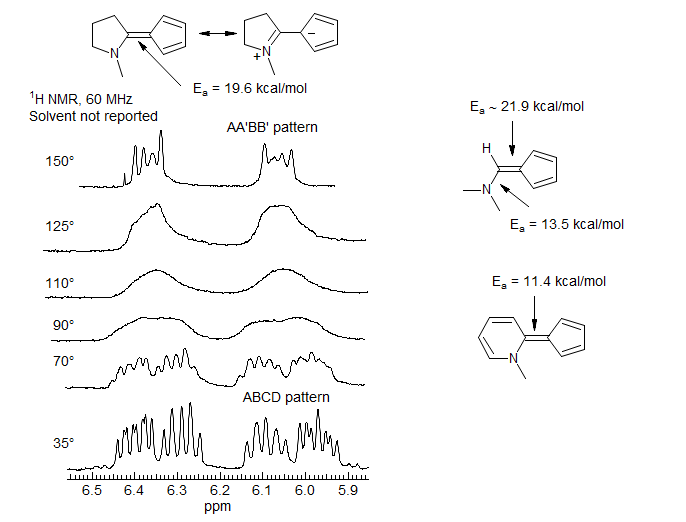
Aminofulvene Double Bond Rotation. The barrier to rotation around simple C=C double bonds are in excess of 50 kcal/mol, much higher than can be measured by DNMR methods. However, formal double bonds in structures which have significant resonance contributors with single bond character can show much reduced barriers to E/Z isomerization. The aminofulvenes below are molecules of this type. The very low barriers to E/Z isomerization indicate that the cyclopentadienide-imonium resonance structure is significant. This is also indicated by the substantial barrier to rotation around the C-NMe2 bond (as indicated by coalescence of the diastereotopic NMe2 group (-10 °C). (Crabtree, Bertelli J. Am. Chem. Soc. 1967, 89, 5384)
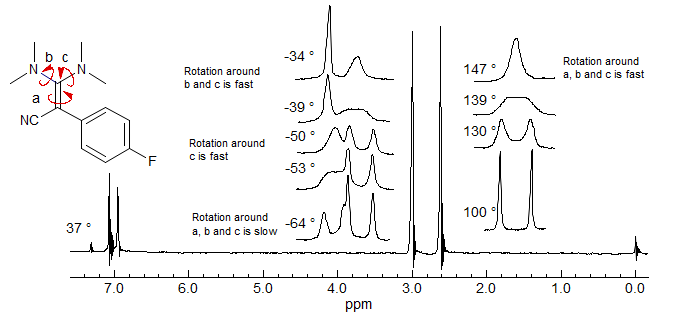
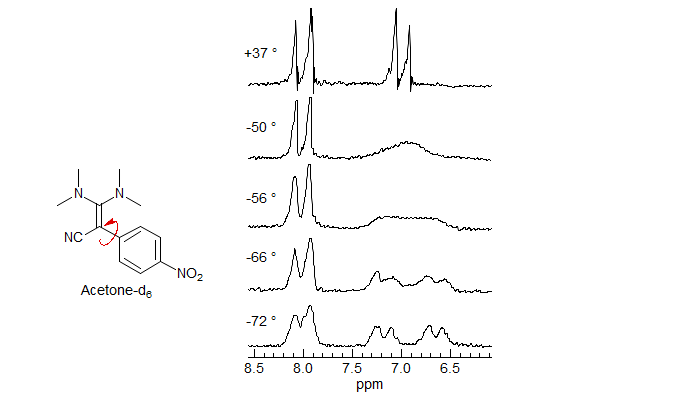
Push-Pull Double Bond Rotation. These diamino cyano alkenes show restricted rotation around 4 different bonds, three of them formal single bonds with double bond character, the fourth a double bond with single bond characater (H. Kessler Chem. Ber. 1970, 103, 973.)
8-TECH-3.7 Detection of Chirality with Diastereotopic Groups
The detection of degenerate molecular processes such as pyramidal inversion or other racemization processes by DNMR often requires labeling of the molecule with some diastereotopic group so that the process can be detected. Below some examples of such labeling.
Pyramidal inversion in Phosphole. Alkyl and aryl phosphines have high barriers to pyramidal inversion (>35 kcal/mol). For the experiment shown below a phosphole was constructed such that the P-iPr group would be diastereotopic in a static pyramidal structure, but inversion at P would equilibrate the methyl environments. Indeed, at low temperature the isopropyl group shows a pair of dd (each Me is coupled to an H and the P), which shows that the equilibrium structure is non-planar. When the sample is warmed the signals broaden and eventually coalesce to a single dd at high temperature (K. Mislow J. Am. Chem. Soc., 1970, 92, 1442). The lowering of the inversion barrier by ca 20 kcal/mole from a non-aromatic model provides an estimate of the aromatic stabilization of the planar phosphole structure which is the presumed transition state for the inversion.

Inversion-Rotation in Carbodiimide. If inversion/rotation at the C=N bonds is slow, the carbodiimide shown would be chiral, and have diastereotopic isopropyl methyls. In fact, if the sample is cooled to -150 °C, the doublet decoalesces to two doublets (F. A. L. Anet J. Am. Chem. Soc., 1970, 92, 2557).

Pyramidal Inversion in a Carbanion Species. In the variable temperature 13C NMR experiment below of a chelated lithiumn reagent several molecular processes can be identified and their rates measured by DNMR. In the static pyramidal structure at low temperature both Si(Me)2 carbons are diastereotopic (four signals at δ 3 to 7). They begin to broaden above -80 °C as inversion becomes fast on the NMR time scale. Note that initially all four SiMe peaks broaden equally, but the pair that is closer together coalesces at a much lower temperature (Tc ca -50 °C) than does the other pair (Tc ca -30 °C). The inversion process does not involve any intermolecular exchange of Li ions, since the Li-C coupling (1:1:1:1 quartet at -7 δ) remains unaffected throughout the temperature range studied.
The pyrrolidine ring carbons at δ 58.5 are diastereotopic in the low temperature spectra, but they broaden and coalesce at -70 °C. This process involves decoordination of the pyrrolidine nitrogen from lithium, rotation around the C-N bond, inversion at nitrogen, and re-coordination. It is about a factor of four faster than inversion at carbon (Reich, H. J.; Kulicke, K. J. J. Am. Chem. Soc. 1995, 117, 6621DOI).


8-TECH-3.8 Double Bond Shifts
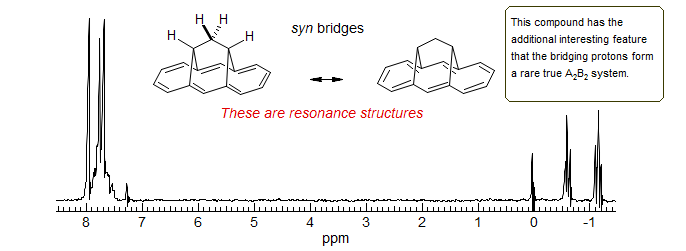
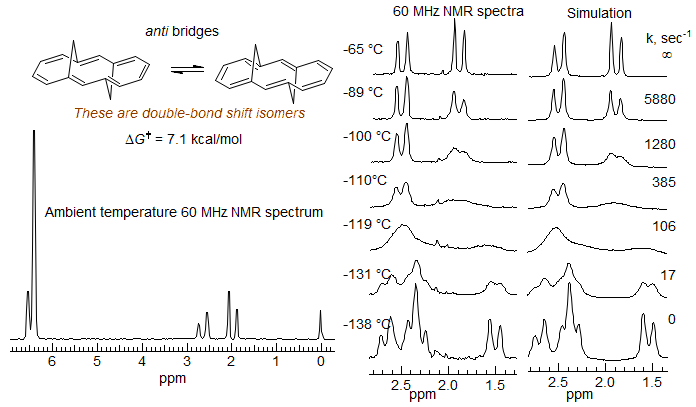
Annulene Double Bond Bhift. The syn bridged annulene is a delocalized aromatic (bis-homo anthracene) compound, as shown by the strong upfield shift of the bridging protons (δ -0.6 and -1.1), and the downfield vinyl protons. In the anti-bridged annulene conjugation is apparently not possible, since the NMR chemical shifts of the bridge protons are normal (δ 1.9 and 2.5). At room temperature the spectrum of the anti compound is symmetric, and shows only a single CH2 group. However, at lower temperatures decoalescence occurs, and two CH2 are seen at -138 °C (Vogel, E. Angew. Chem. 1970, 82, 510, 512). At this temperature the double-bond shift is slow on the NMR time scale. The activation energy for bond-shift is ΔG‡ = 7.1 kcal/mol. Thus the two representations are resonance structures for the syn compound, but valence-bond isomers in the anti.
8-TECH-3.9 Bimolecular Ligand Exchange
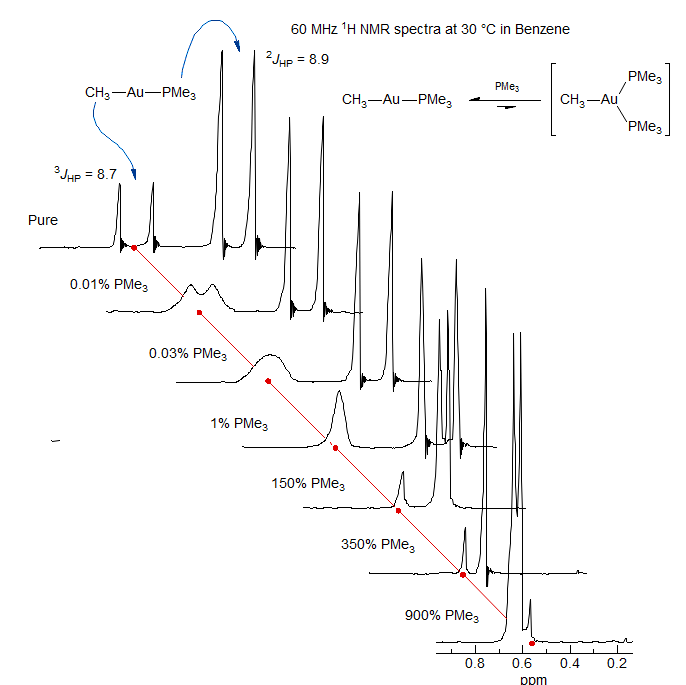
Phosphine Ligand Exchange in Gold Complex. DNMR experiments usually involve changing temperature to change the rates of molecular processes, but other variables which change rates and result in averaging of shifts and coupling constants can also be studied. In the series of spectra below, increments of PMe3 ligand were added to a solution of a gold-phosphne complex, which initiates a bimolecular exchange between bound and free ligands, causing loss of 3J coupling between the CH3-Au protons and P. Initially no change is detectable in the PMe3 protons because the fraction of free ligand is <1%. When a significant fraction of PMe3 has been added, however, the PMe3 signals move downfield because of averaging between free and bound ligand. The apparent coupling also decreases, and becomes 0 at 350% PMe3. Coupling between H and P reappears when 9 equivalents of PMe3 have been added, with J close to that of the pure ligand (2.6 Hz). This shows that 2JHP has opposite signs in the free and bound ligands (Shiotani, A.; Klein, H. F.; Schmidbauer, H. J. Am. Chem. Soc. 1971, 93, 1555).
